

The Four Layers of Goals Every Data Platform Team Needs to Understand
How to connect data infrastructure work to business outcomes (even when you're three steps removed from revenue)


Most product management literature will tell you that internal product management is complex. I agree. Data Platform teams might be tracking adoption rates (”80% of teams use our data catalog!”) while leadership questions their return on investment (RoI).
On top of this, your users are colleagues you can grab coffee with or Slack anytime. But you’re building data infrastructure that enables them to deliver business impact, which puts you at least one step removed (sometimes two or three) from the outcomes that actually matter to the company. That’s the paradox of internal platform work: easy access to your users, but hard to measure your impact.
In this article, I walk you through the different types of goals Data Platform teams can use —from platform outputs to business outcomes —and strategies for getting started.
The Four Layers of Platform Goals
I’ve spent my career managing teams that build data platforms. After years of struggling with goal-setting, I’ve found it helps to think about platform goals in four distinct layers, from farthest to closest from direct business impact, as you can see in the following image:
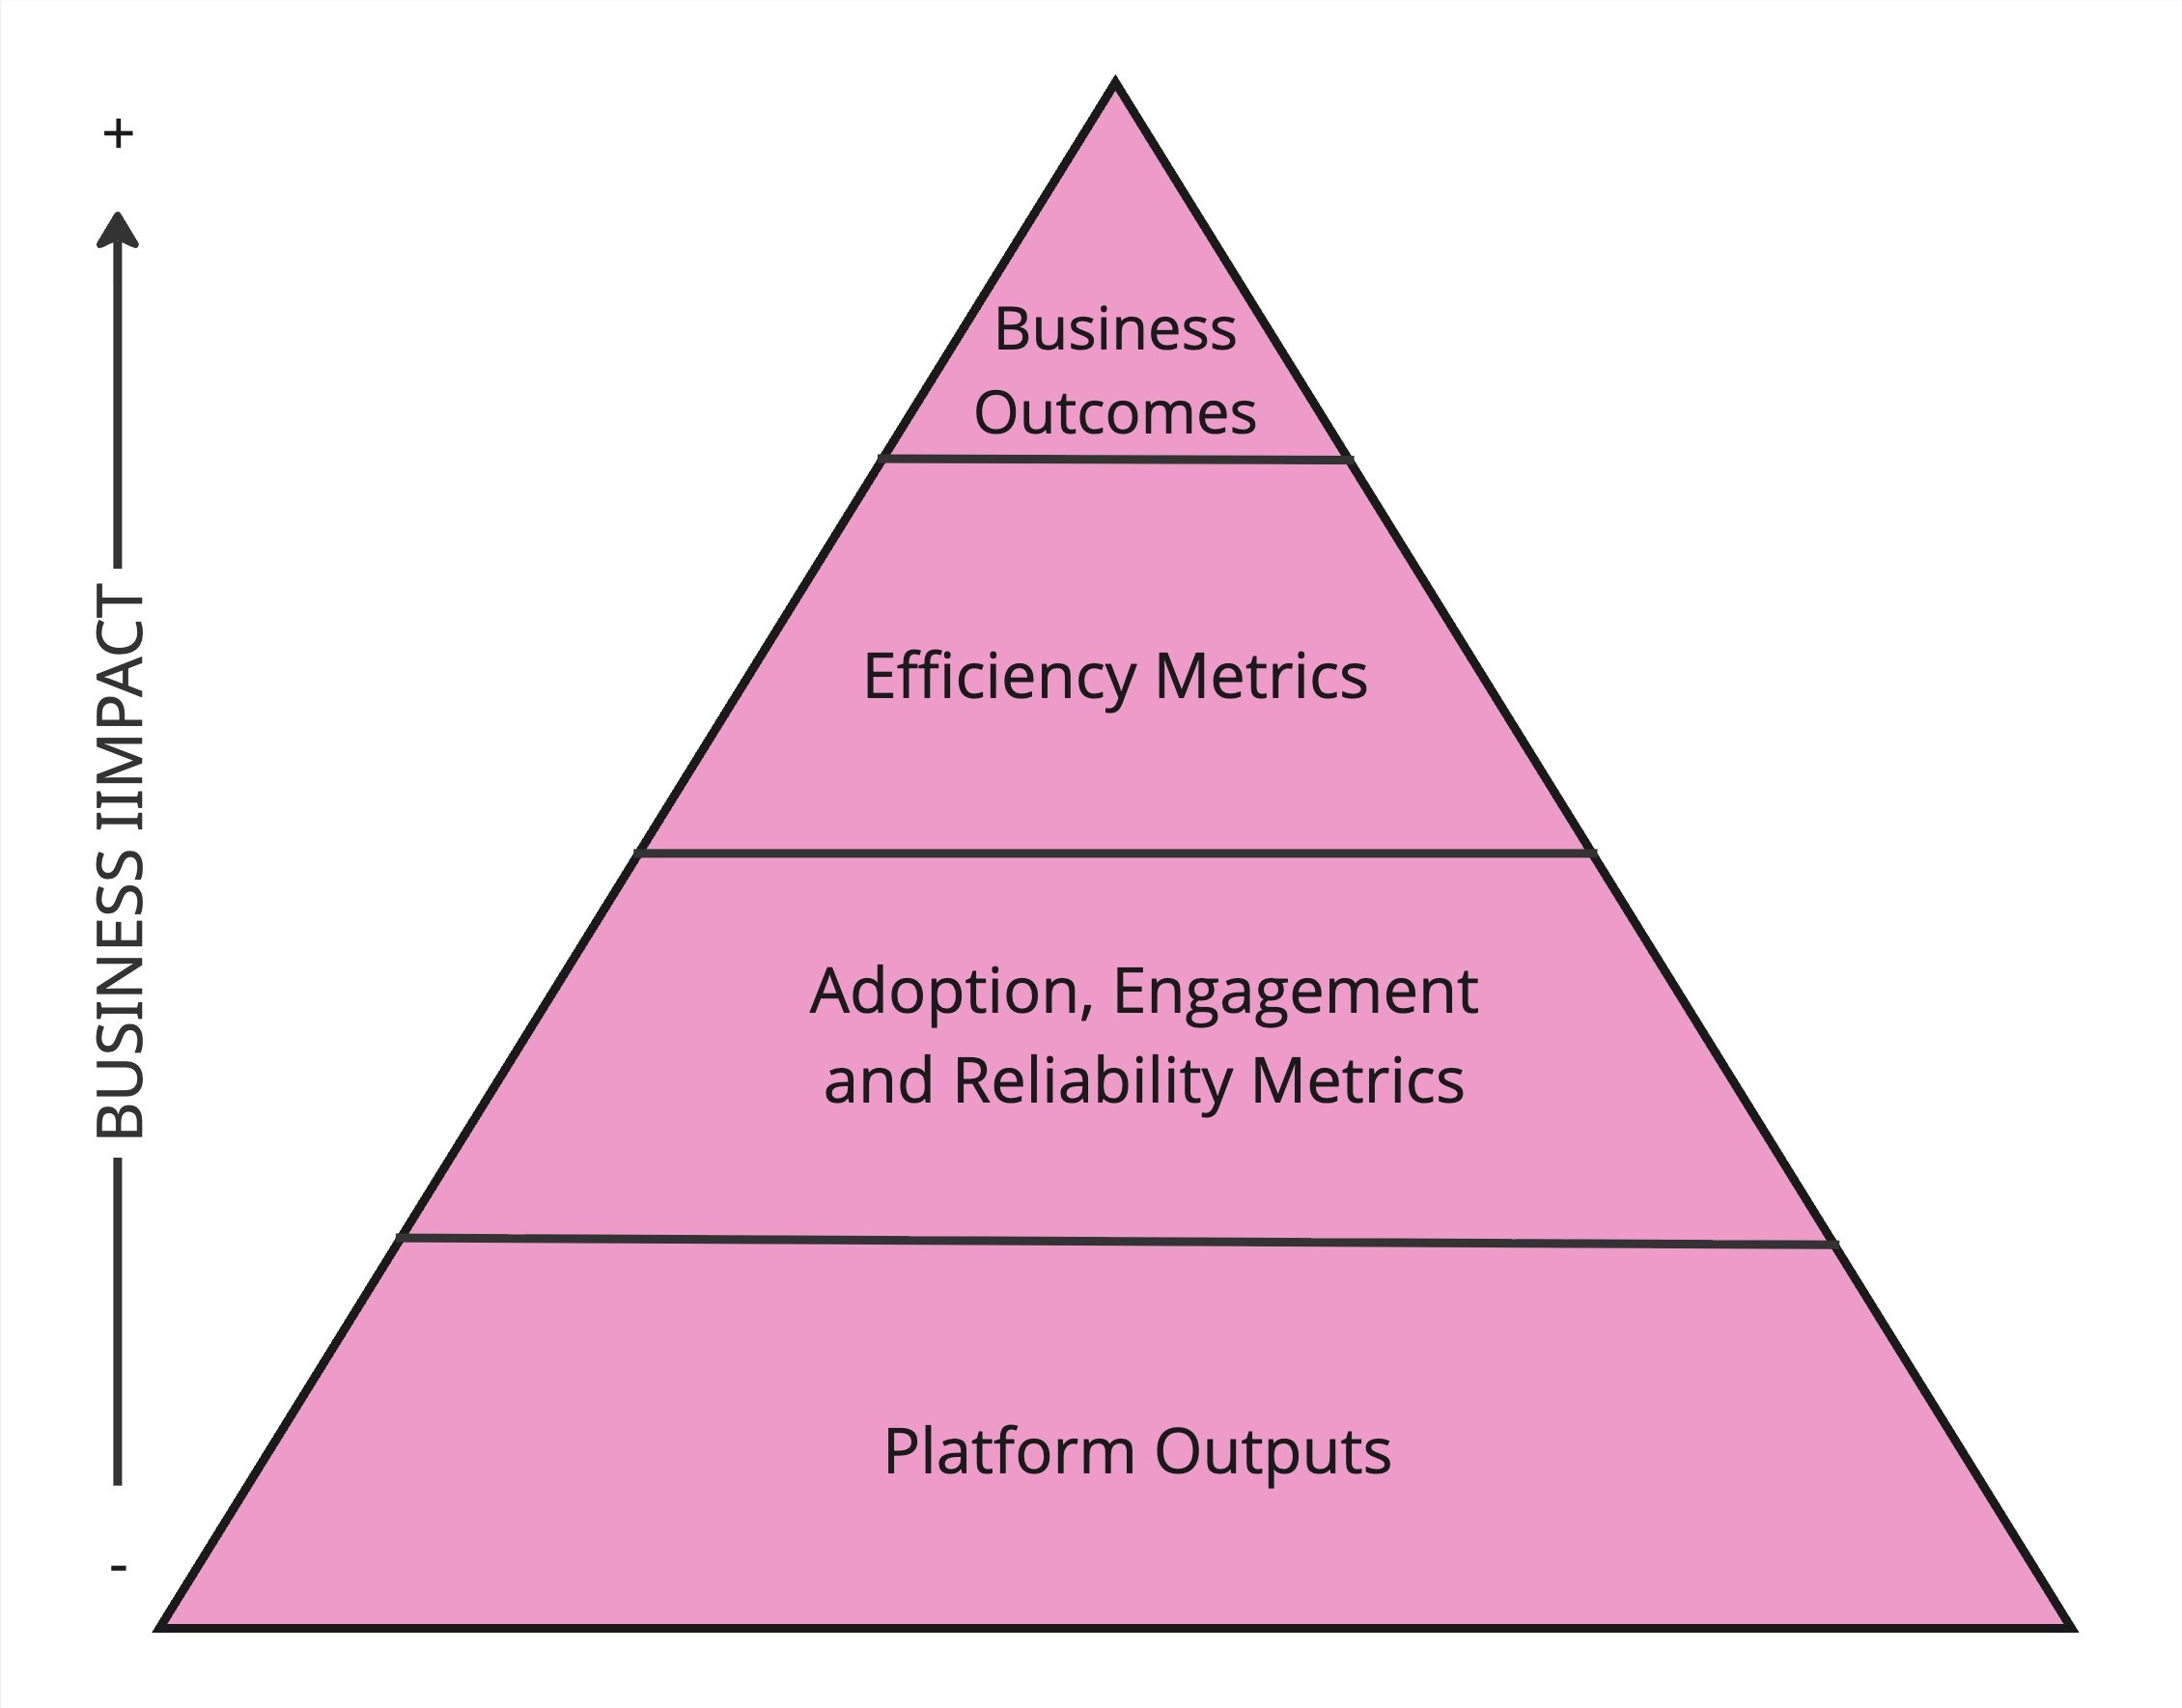
Now, from the bottom of the pyramid to the top, let me introduce the layers:
Platform Outputs: measures features shipped, tickets closed, tools implemented.
Adoption, Engagement, and Reliability Metrics: measures usage rates, active users, system uptime.
Efficiency Metrics: measures time saved, manual work eliminated, decision cycle time reduced.
Direct Business Outcomes: measures revenue impact, cost reduction, risk mitigation.
Of course, everyone wants goals at Layer 4 (Direct Business Outcomes). But that’s not always possible for data platform teams. Think of the pyramid as a hierarchy of preference, not a hierarchy of value. Aim as high as you can and be explicit about which layer you’re operating in.
Now, in the following sections, let’s deep dive into each layer.
Layer 1: Platform Outputs
This is where all platform teams start, but where you don’t want to stay for long. Platform outputs are things you directly control and ship. They’re easy to measure but tell you nothing about impact.
Examples of platform outputs include:
Features shipped this quarter
Tickets closed
Tools implemented
Migrations completed
Datasets documented
Machine Learning models deployed
While these are not bad per se, they only show that your team is busy, but don’t articulate how they are helping the organization. At some point, and especially after the ZIRP (zero-interest-rate policy) era is over, leadership starts asking more complex questions about return on investment. When capital was cheap, companies could afford to fund platform work on faith. Now, shipping features without showing their impact is a fast path to budget cuts.
Use Layer 1 goals only when you are starting a new team or dealing with technical debt that must be paid down urgently. Try to move quickly to deeper layers for most of your initiatives.
Layer 2: Adoption, Engagement, and Reliability Metrics
This layer measures whether people actually use what you build and whether it works when they need it. You’re still not measuring business impact, but you’re getting closer.
Examples include:
Platform adoption rates (percentage of teams using your data platform or its subsystems)
Active users per month or week
Query volumes through your platform
System uptime and reliability (DORA metrics like deployment frequency, lead time, mean time to recovery)
Reduction in data quality incidents
API call volumes
Support ticket reduction
Adoption is a useful metric. But it’s not a measure of success by itself. As Camille Fournier and Ian Nowland warn in their book Platform Engineering (2024): “The risk of using adoption metrics when you are targeting a captive or nearly captive audience is forgetting to build what people want, and instead building what you think they should want and then forcing them to use it.”
Let’s see how this can be improved in the next layer.
Layer 3: Efficiency Metrics
In this layer, you’re measuring whether your platform makes work faster or easier. These metrics show productivity gains such as time saved, manual work eliminated, or faster decision-making.
Fournier and Nowland explain: “Core to the value of platform engineering is the concept of leverage—meaning, the work of a few engineers on a platform team reduces the work of the greater organization. Platforms achieve leverage in two ways: making applications engineers more productive as they go about their jobs creating business value, and making the engineering organization more efficient by eliminating duplicate work across application engineering teams.”
Examples of this leverage include:
Time from question to insight reduced from 8 hours to 1 hour
Self-service rate increased from 20% to 60% (freeing analysts for strategic work)
Decision cycle time decreased from weeks to days
Time to onboard new data sources reduced from weeks to days
Having said that, and as stated before, there is nowadays a pressing need for data platform teams to deliver positively on efficiency gains. However, it is also a good compromise if you and your senior management peers agree to acknowledge that when your data platform team reduces an analyst’s weekly preparation time from 8 hours to 1 hour, you haven’t necessarily reduced your payroll by seven hours’ worth of salary. Instead, you’ve created capacity for higher-value work, which, at the moment of realizing the efficiency gain, is very hard to measure its impact.
Still, if you want and can calculate the impact of data platform work to the penny, there is Layer 4.
Layer 4: Direct Business Outcomes
This is the gold standard. Your work directly connects to money, risk reduction, or strategic outcomes that the business cares about.
Examples include:
Ability to link specific A/B tests to revenue increases and then attribute them to the platform
Cost reduction from infrastructure optimization
Revenue attribution from recommendation systems or personalization engines
The challenge with Layer 4 is proving causation, not just correlation. It might be easy to attribute cost reduction to the deletion of several unused data assets. Still, it is much more complex to determine which part of a recommendation engine's impact can be attributed to the data platform itself.
If you want to go down that path, you’ll create complex calculations in spreadsheets that assume too much information. However, if everyone in the organization uses the same assumptions (good luck with that!), your attribution tracker won’t provide numbers that Finance can use, but they will still be useful for comparing initiatives.
And another challenge most companies ignore: the cost side of the equation. Let’s say your data platform team costs $1 million per year in salaries. You spend another $250,000 on tools and infrastructure. That’s $1.25 million in annual operating costs. If you implement a data lineage tool that saves analysts time, you need to show that the value created exceeds the corresponding investment.
Next Steps: Moving Up the Layers
So far, I’ve shown you that the four layers of platform goals exist on a spectrum from outputs to outcomes. Your challenge now is moving up that spectrum. Here’s my recommendation on how to do that:
Establish your baseline. Audit your current goals and classify them by layer. If everything sits at Layer 1, you have work to do.
Pick one capability to instrument. Choose something your team already built that stakeholders use regularly. Add basic adoption metrics (Layer 2). Track who uses it, how often, and whether usage grows.
Find one efficiency story. Identify where your platform demonstrably saves time or eliminates manual work (Layer 3). Quantify it, even roughly.
Document your costs. Calculate your team’s annual operating budget, including salaries, tools, and infrastructure. You need this baseline before claiming any Layer 4 outcomes.
Start the conversation. Share this framework with your leadership. Ask which layer they expect platform teams to operate at. Get alignment before you invest months pursuing the wrong metrics.
The goal isn’t reaching Layer 4 immediately. The goal is to operate at the highest level you need and can credibly measure, and to be transparent about the distance between your work and business outcomes. That honesty, combined with deliberate progress up the layers, builds the trust platform teams need to survive budget scrutiny.
Enjoyed this post? You might like my book, Data as a Product Driver 🚚.